Senior Design: CRISPR-Cas9 Excision Therapy Suitability
- 6 minsCode & Algorithims:
Please refrence my code: https://github.com/parthspatel/Senior-Design
Problem:
Currently, there is a therapy utilizing CRISPR-Cas9 to remove the HIV Genome from infected cells. This is done through designed guide RNA(gRNA) strands, developed to target a wide range of patients and minimize off-target effects, and used to direct CRISPR for cleavage. Through the research of Dr. Will Dampier there are four primary gRNA sequences that have been developed to treat HIV subtype B. However, it is difficult to determine if these gRNA’s will be effective in a patient.
Currently, the lab uses Next Generation Sequencing(NGS) which is time consuming and expensive to sequence the 600 base pair HIV long terminal repeat region (LTR). Some complications with the current method are:
- 96 samples are required to run NGS cost effectively, taking upwards of 3 months to collect
- Data collected from NGS is very noisy with a 1:10 ratio of HIV DNA to human DNA
- NGS process is very long and complicated taking 8 - 10 days to prep and run samples
- High risk of HIV mutation and patient having a new primary strain in the 3 months
Objective:
The objective of the project is to develop a time-efficient, high throughput, and accurate screening strategy for the current CRISPR therapy.
Solution:
Utilize a microarray analysis chip, seeded with custom probes, in combination with an analysis method to convert microarray data into patient suitability.
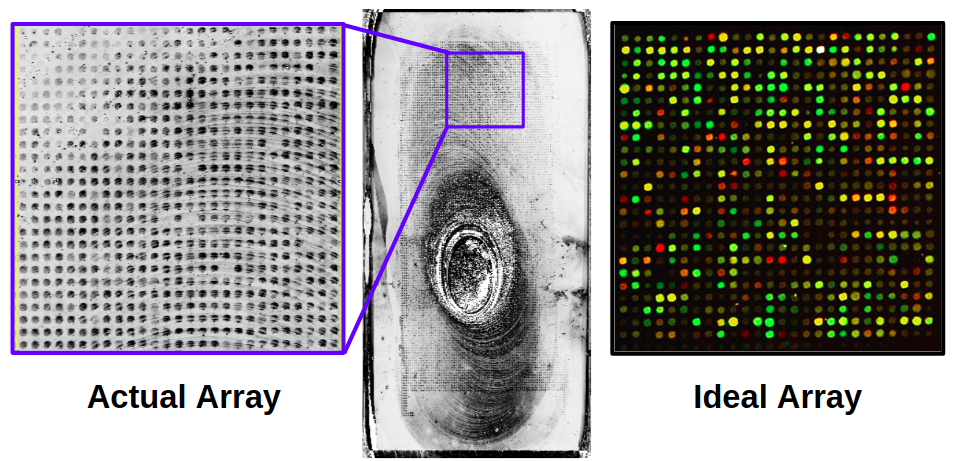
A DNA microarray is a microscope glass slide with thousands of ‘spots’ printed on it. These spots are populated with specific & defined synthetic DNA sequences and are known as probes. An experiment is performed using the microarray, where two samples of DNA are mixed and placed on the array. These DNA samples are tagged with different dyes and when allowed to bind to the probes and scanned, they fluoresce. This fluorescence tells us how much of which DNA sample bound to that specific probe.
By strategically selecting which DNA sequences to place on the microarray we can leverage the fluorescence to inform us of which HIV strains a person has.
The sequences were selected by looking at HIV LTR regions of patients with HIV subtype B in the US from the Los Alamos National Laboratory HIV Sequence Database. I then extracted and filtered the data with the following criteria:
- 23 base pair sequences
- Contains the Cas9 PAM sequence or it’s compliment
- Does not contain any degenerate base pairs I was then left with a set of ~30,000 unique sequences. The graph below represents the distribution of sequence throughout the population.

As one can see, there are a lot of sequences that occur very rarely in the population. Filtering out sequences that occur in less than 0.1% of the population, the total number of sequences can be reduced from ~30k to 4,115. These four thousand sequences represent sequences that occur in 99.9% of the population. This was done to reduce the number of sequences to reduce the cost per sample of the microarray.
These sequences were then sent out to be manufactured onto a microarray by Arbor Biosciences. We ordered 2 microarrays with 3 sets of probes on each. Each set of probes contained triplicates of the 4,115 sequences. This was done to combat partial binding of sample DNA to the microarray probes. With three of each sequence, we can get an average binding and reduce the effect of outliers.
Once the arrays were delivered, we started testing. We had planned two experiments:
- Confirm there is different binding of infected cells and healthy cells
- Test the specificity of the microarray. ie. Can the array detect 1:1000 HIV DNA to healthy control DNA.
Both arrays had failed to provide usable data. The first array was oversaturated due to a missing reagent during sample prep and no DNA bound. The second array also failed, however this time we were able to see that binding did occur. Although, due to lab restrictions the only output was a greyscale image. The resultant image has massive residues that obscure a large portion of the probes, and only one of the three sets of arrays had observable data. The second array result can be seen in the image below.
Determining Suitability:
In order to determine patient suitability one must derive a method to characterize the microarray intensity values.
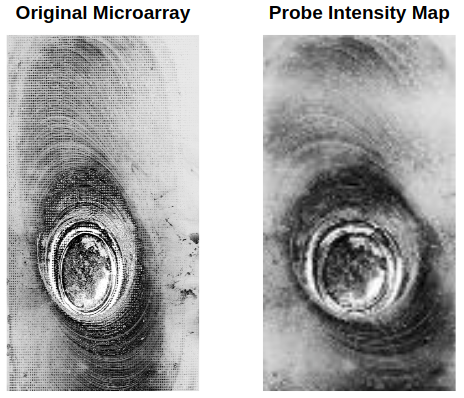
Intensity values from the array are determined by analysis of the output image. The center of each probe is found using a center finding algorithm and then the average intensity for each probe is determined. The resulting image will look similar to the one below. Comparing these values to control probes with 100% and 0% binding, one can then determine how much of what DNA bound to the microarray.
Next, we have to determine if the developed CRISPR gRNA sequences are compatible with sequences in the patient. This is done by utilizing the crisprtree module which allows one to compare a gRNA and target sequence, determining the CRISPR binding probability. Doing this for every gRNA and microarray probe sequence combination, we can develop a profile of which probes are CRISPR compatible.
Combining the crisprtree probability with the microarray intensity values we can determine how many of the patient’s HIV strains are compatible with the therapy. This is done using the following formula:

Since both microarrays failed to produce viable images the full algorithm cannot be used to determine patient sutibility.
Conclusion:
Although, it was not possible to determine the efficiency of our custom designed microarray probes, the solution is significantly faster than the current solution. It would take the lab 1 week to gather, run, and analyze samples for the microarray. Where, the current solution takes the lab 12 weeks to gather, run, and analyze samples. If the microarray procedure could be improved through further testing, this presents a valid screening solution.
Future Direction:
- Refine and correct microarray verification procedure
- Successfully determine patient suitability using a microarray with the described analysis method
- Develop and use a better CRISPR-Cas9 binding & cutting predictor
Code & Algorithims:
Please refrence my code: https://github.com/parthspatel/Senior-Design
Resources:
[1]: https://www.genome.gov/10000533/dna-microarray-technology/

[2]: Hsu, P. D. (2013). DNA targeting specificity of RNA-guided Cas9 nucleases. Nature Biotechnology, 31(9). Retrieved November 23, 2017.

[3]: http://crispr.mit.edu/about

[4]: https://www.hiv.lanl.gov/content/sequence/HIV/mainpage.html